
From green dashboards to 2 a.m. fire drills
An SRE job can feel like two careers jammed into one — sometimes in the same afternoon.
On good days, you’re improving the platform, paying down technical debt, and watching error budgets trend in the right direction. On bad days, you’re staring at a wall of red, bouncing between five tools, and trying to debug a production outage with logs that are either locked behind a tool you can’t query or sitting cold in object storage with no easy way to reach them.
You own uptime, performance, and incident response. You’re also caught between budget constraints, tool sprawl, logs that have never been collected, and a permanent queue of “quick asks” from application teams who need production visibility but don’t have access to get it themselves.
That’s the world Cribl products are designed for. The same investigation experience it brings to security and IT teams — streamlined, AI-assisted exploration, shareable Notebooks — translates directly to SRE and platform engineering advantages. The goal is to turn telemetry into something you can actually use during an incident, not after it.
Before we follow a senior SRE through their day, it’s worth naming the specific things that make reliability work harder than it needs to be.

Why keeping things running is so hard
The data is everywhere — and nowhere when you need it
Observability data doesn’t live in one place. Only a fraction of that telemetry makes it into the premium observability stack and that fraction is usually defined by license limits, not by what you actually need to debug production. During an incident, that gap shows up as doubt: you can’t be sure you’re seeing the whole picture, and “the data is probably in object storage somewhere” is cold comfort when you’re burning through your error budget.
Getting to the data is its own problem
Even when the data technically exists, the path to it isn’t clean. Wide time-range searches can bog down the observability stack that the rest of engineering depends on. Diving into archives means restore tickets and waiting. Correlating metrics, traces, and logs across vendors often devolves into screenshots, copy-pasted IDs, and notes in a personal notebook that will be useless to the next person on call.
Simple questions — “What changed right before latency spiked?” or “Show me everything this pod did in the last 48 hours” — can turn into hours-long investigations that don’t scale.
Developers need visibility you can’t easily give them
SRE teams are supposed to help developers ship faster and safer, not be gatekeepers. But access models and cost controls get in the way. Developers can’t get into observability tools at all, can only see a narrow slice of data, or are quietly discouraged from running ad hoc queries because of the cost impact.
When developers can’t see production, every incident funnels back through SRE. You end up running pointin- time queries and explaining log output instead of improving the platform.
AI agents are compelling in theory, but expensive in practice
Many teams are experimenting with AI-SRE agents for alert triage, query generation, or incident timelines. The idea is solid, though the reality is that most observability stacks were architected and priced for human query volumes — not agents generating an order of magnitude more questions per hour. Point an agent at a premium APM or SIEM and it quickly becomes the noisiest user in the building. Queries get throttled. Dashboards slow down. Costs spike. Teams pull back before they can see any real value.
What you need is an investigation surface designed to handle agentic workloads without punishing everyone who just needs their dashboards to load.
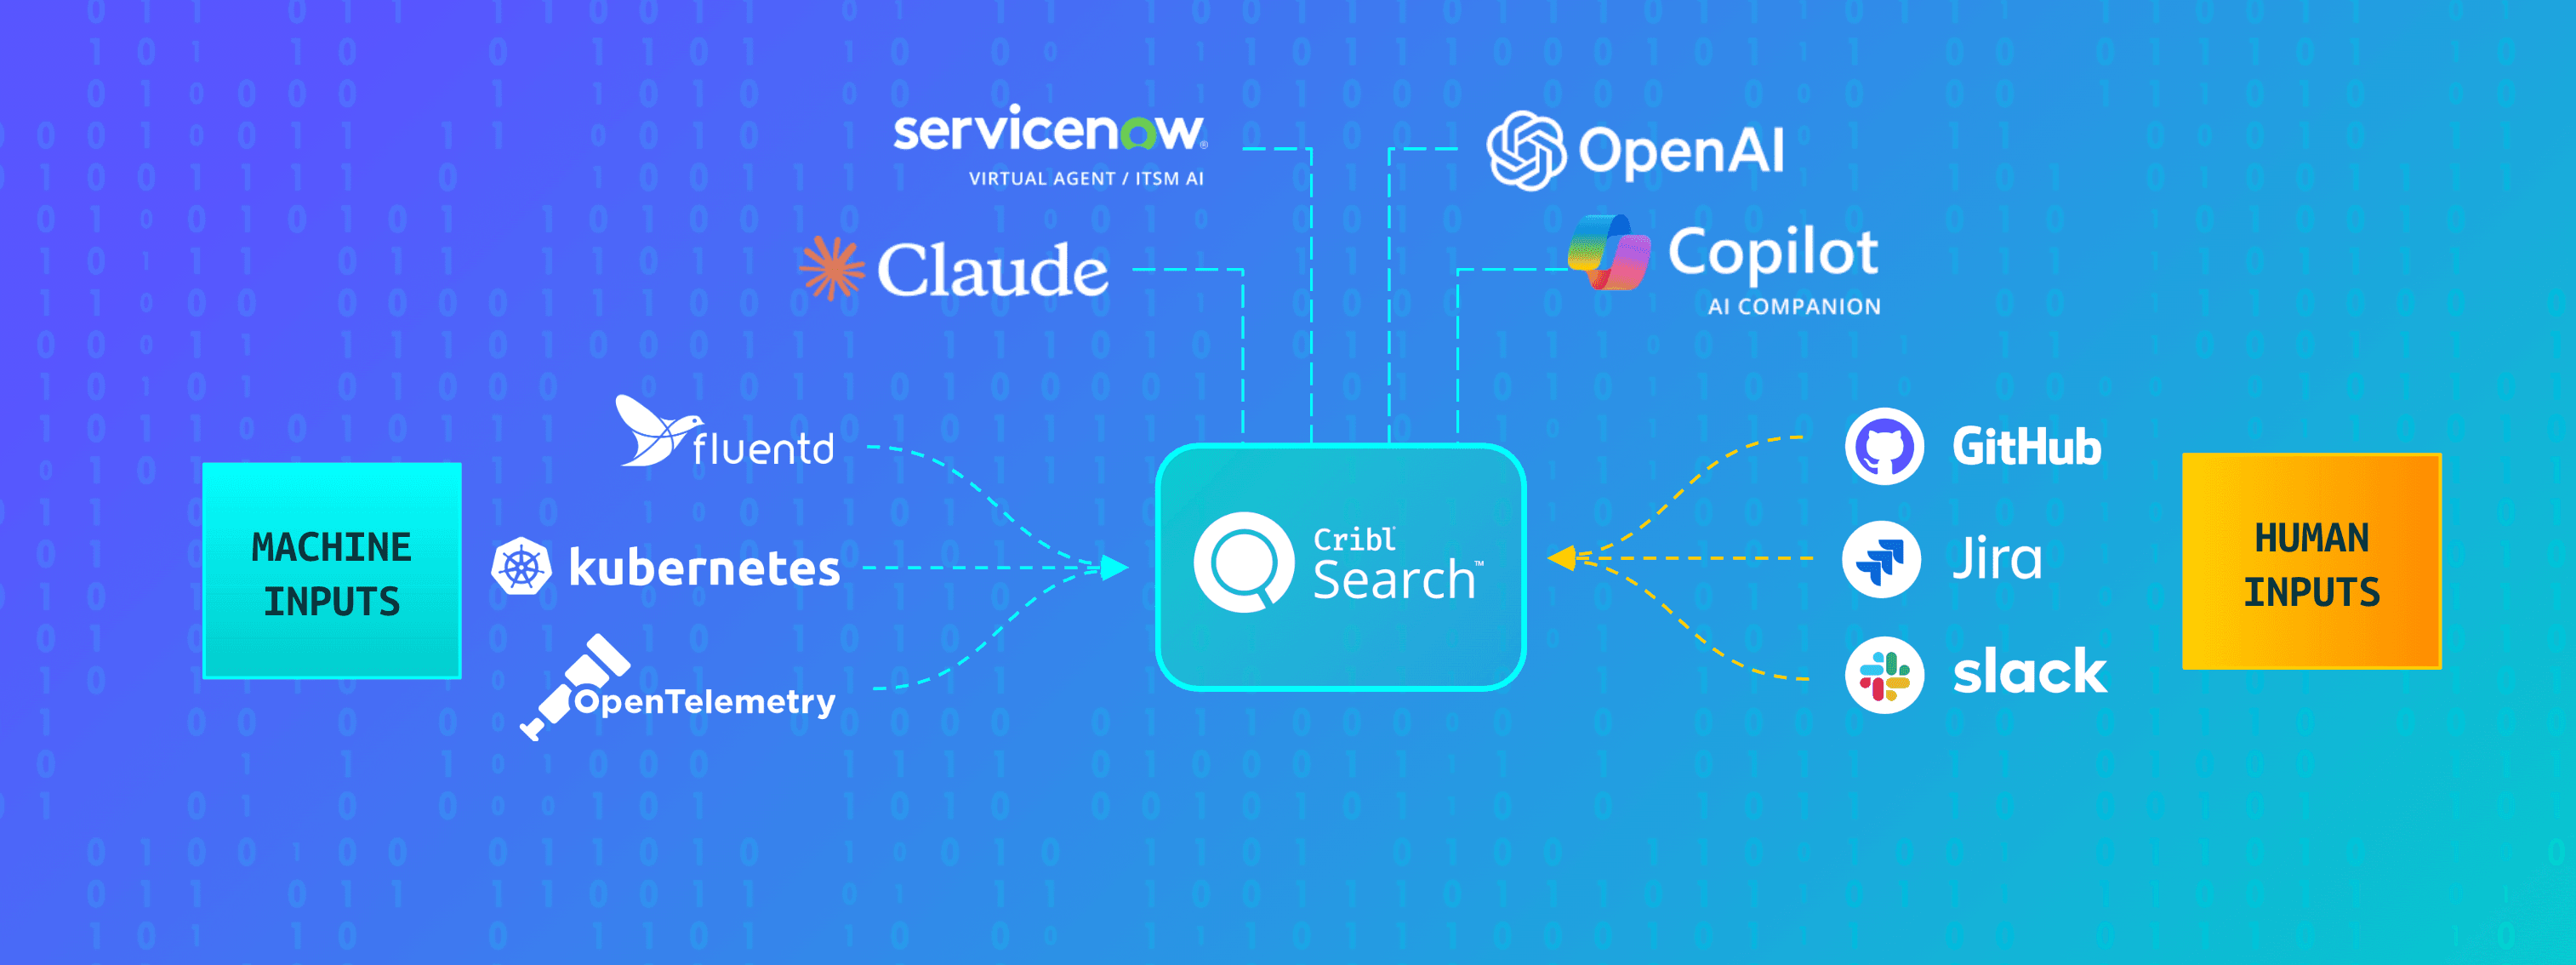
How Cribl fits in
Cribl gives SRE teams a unified place to collect, store, and investigate reliability data — one that’s designed for AI-scale workloads but practical enough to fit into a real on-call rotation.
The architecture is built around a few core ideas:

Collect telemetry once through a vendor-neutral data plane.

Route it into low-cost datasets.

Parse the data to make that data fast to search through a unified investigation surface.
The result is a single place to onboard data, keep it, and actually use it during incidents — without constantly rebuilding pipelines or filing restore tickets.
On top of fast search, Cribl is building AI-assisted exploration that can help compose queries against unfamiliar data, summarize large result sets into readable narratives, and suggest next steps when you’re staring at a vague symptom. Cribl Notebooks lets teams capture not just what happened during an incident, but how they figured it out — key queries, annotated steps, saved searches — turning one-off heroic investigations into reusable runbooks. This can be captured in formats like .pdf and added to the post-incident review.
And because Search is backed by object storage and a high-speed analytics engine, it can absorb agentic query workloads that generate far more requests than human investigators could, without affecting the rest of the stack.
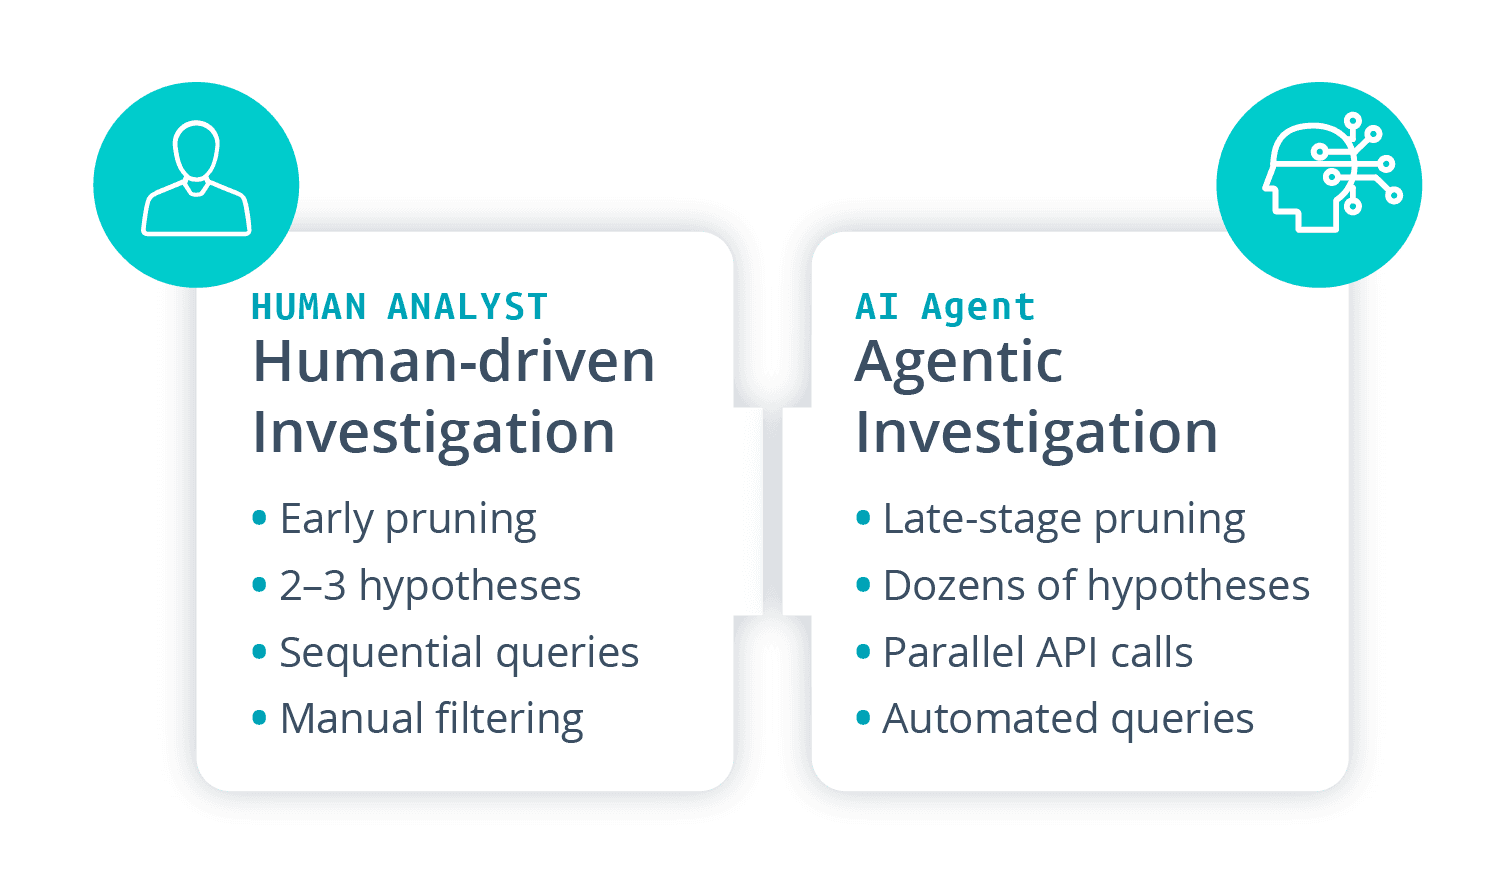
The Hidden Cost of Agentic Investigation
AI Agents Investigate at Machine Scale — Not Human Scale.
A day in the life: Jordan, Senior SRE

Jordan is a senior SRE at a global SaaS company running a multi-tenant microservices platform on Kubernetes. Their team owns reliability for core APIs, billing, and customer-facing dashboards.
Before Cribl, Jordan’s day meant constant tool-hopping: APM for metrics and traces, one log tool for recent data, object storage plus ad hoc scripts for cold logs, and scattered internal wikis capturing what actually happened during incidents. It worked, but it didn’t scale.
Here's what a day looks like now.
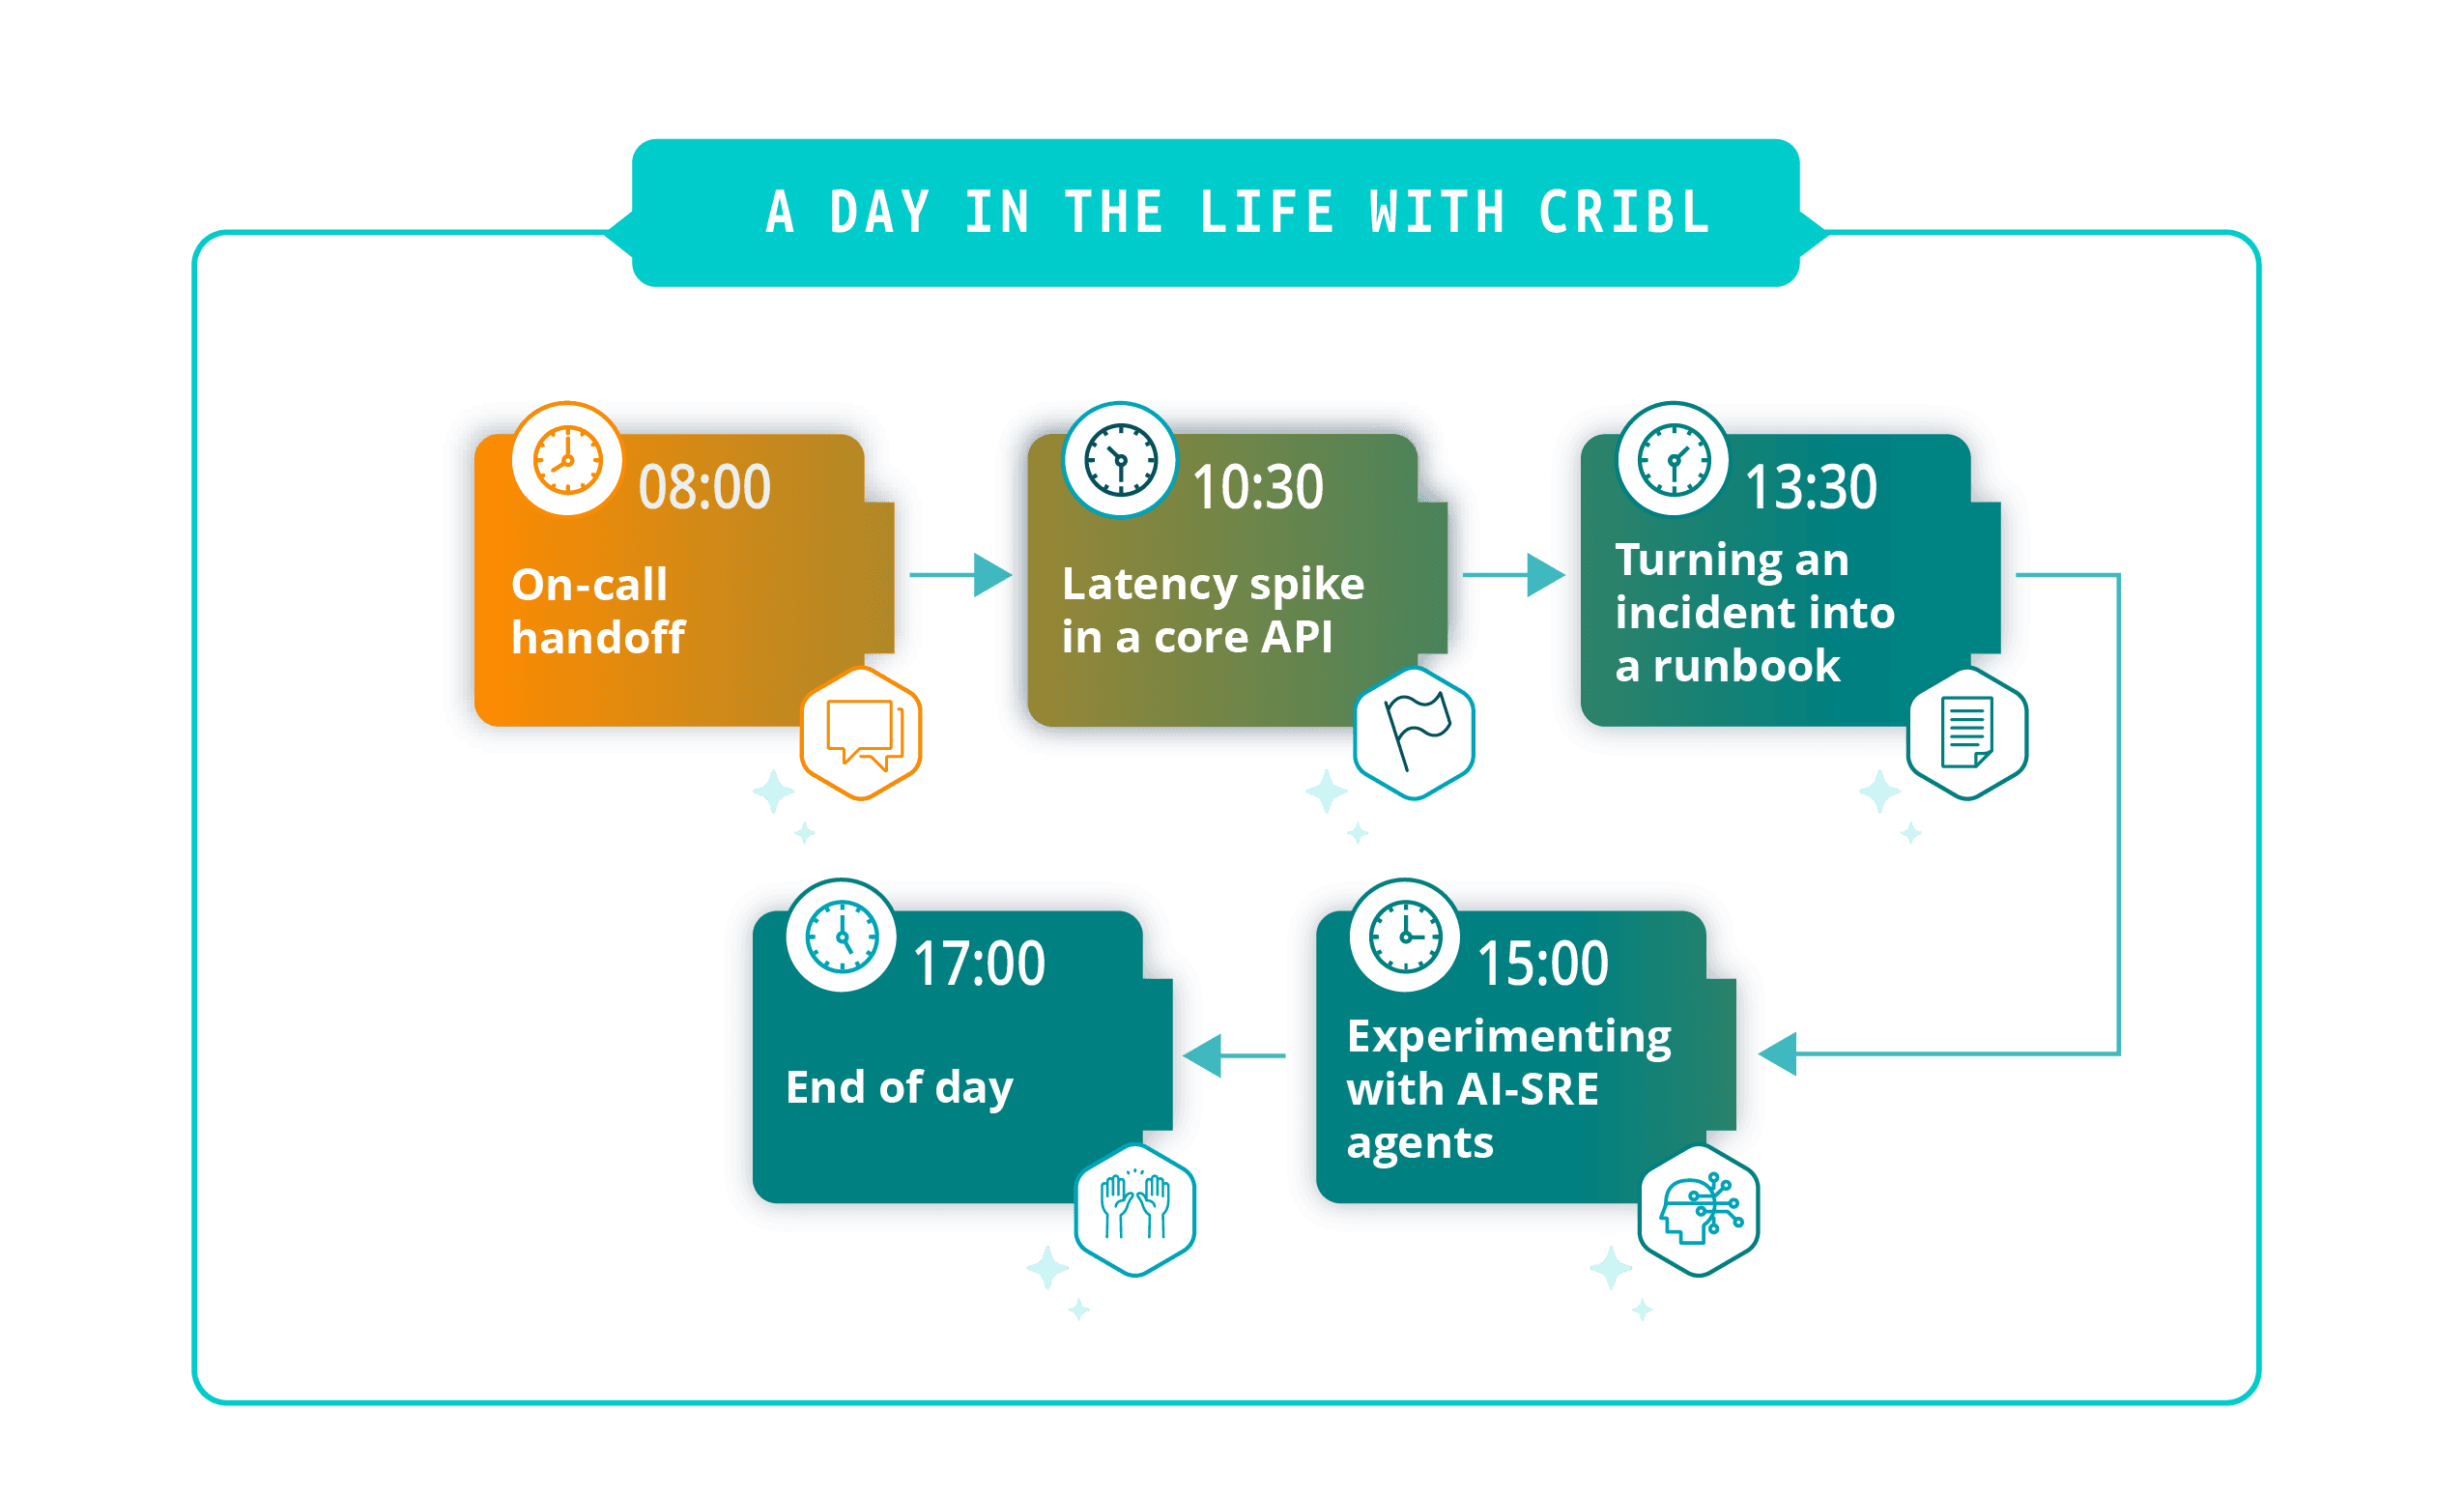
08:00 – On-call handoff
Jordan starts the morning reviewing last night’s incidents.
Before, handoffs meant scanning whatever made it into the ticketing system, a few screenshots, and hoping whoever was on call remembered the key details at 3 a.m. There was no reliable way to replay the investigation.
Now, major incidents have notebooks attached. The previous SRE’s queries, hypotheses, and decisions are all there. Jordan opens the notebook for a latency degradation that fired overnight, sees the timeline, reviews the saved searches, and reruns them to confirm things are quiet. Instead of guessing what happened, they’re reviewing a shared record and deciding what to follow up on.
10:30 — Latency spike in a core API
Alerts fire mid-morning for a high-traffic customer API. Error rates are climbing. The incident channel fills. Product wants to know, “Is this us or a third-party dependency?”
Jordan opens a Search workspace scoped to the affected service and pulls recent logs from the service’s pods, the ingress controller, and the upstream payments dependency. They query Kubernetes events and deployment changes for the last hour and pull load balancer logs from object storage without re-ingesting them anywhere. What used to require three tools, two browser windows, and at least one restore ticket is now happening in one place.
Jordan validates the findings directly in the raw logs. The assistant didn’t replace their judgment — it saved 20 minutes of manual aggregation. Armed with that picture, Jordan shifts traffic away from the impacted region, flags the issue with the provider, and posts a specific update to the incident channel instead of “still investigating.” Once things stabilize, they bookmark the searches and annotate the notebook with what worked, what didn’t, and what signals were most useful.
13:30 — Turning an incident into a runbook
After lunch, Jordan takes the morning’s investigation and makes it useful for the next person.
Using the notebook, they capture the step-by-step flow: the queries they ran, the signals they looked at first, the checks that weren’t obvious in the heat of the moment — like confirming no unusual deployment activity in adjacent regions. The notebook is tagged with the affected service, dependency type, and incident pattern.
The next time this shows up — whether for this service or another one running on the same dependency — the on-call SRE doesn’t start from scratch. They open the notebook, swap in a different service or region, and work through a proven checklist in minutes instead of guessing for an hour. Over time, that builds a library of runbooks backed by real investigations, not idealized flowcharts written after the fact.

15:00 — Experimenting with AI-SRE agents
Jordan’s team is piloting AI-SRE agents to help with noisy incidents and recurring triage tasks.
When they pointed early prototypes at their observability platform, it was a disaster. The agents became the worst power users the system had ever seen. Queries stacked up. Other teams complained about slow dashboards. Finance started asking questions about projected spend. The pilot was quietly shelved.
Now the agents are pointed at Cribl Search and the datasets backed by object storage. Because Cribl can parse complex logs into datasets that can be quickly searched and is designed to absorb high query volumes without degrading the rest of the stack, the team can safely let agents generate initial hypotheses when an incident starts. They can also scan weeks of logs to surface similar past incidents and suggest which saved searches to run first, based on the alert payload. If an agent goes a little wild, it’s hitting a system built for that — not the cluster keeping dashboards up for the rest of engineering.
Jordan still owns the decisions. The agents reduce cognitive load; they don’t automate reliability away.
17:00 — End of day
Once the fires are under control, Jordan makes sure today’s work pays off tomorrow.
Post-incident reviews pull directly from notebooks and saved searches — no reconstructing timelines from memory and screenshots. Developers can run their own searches over the same data, including logs in object storage, without waiting on SREs to tee things up. On-call rotations feel more sustainable. Runbooks exist and work. Investigations start with context instead of a blank screen.
Instead of every incident feeling like a new boss fight, the team is slowly turning production chaos into shared, reusable knowledge.
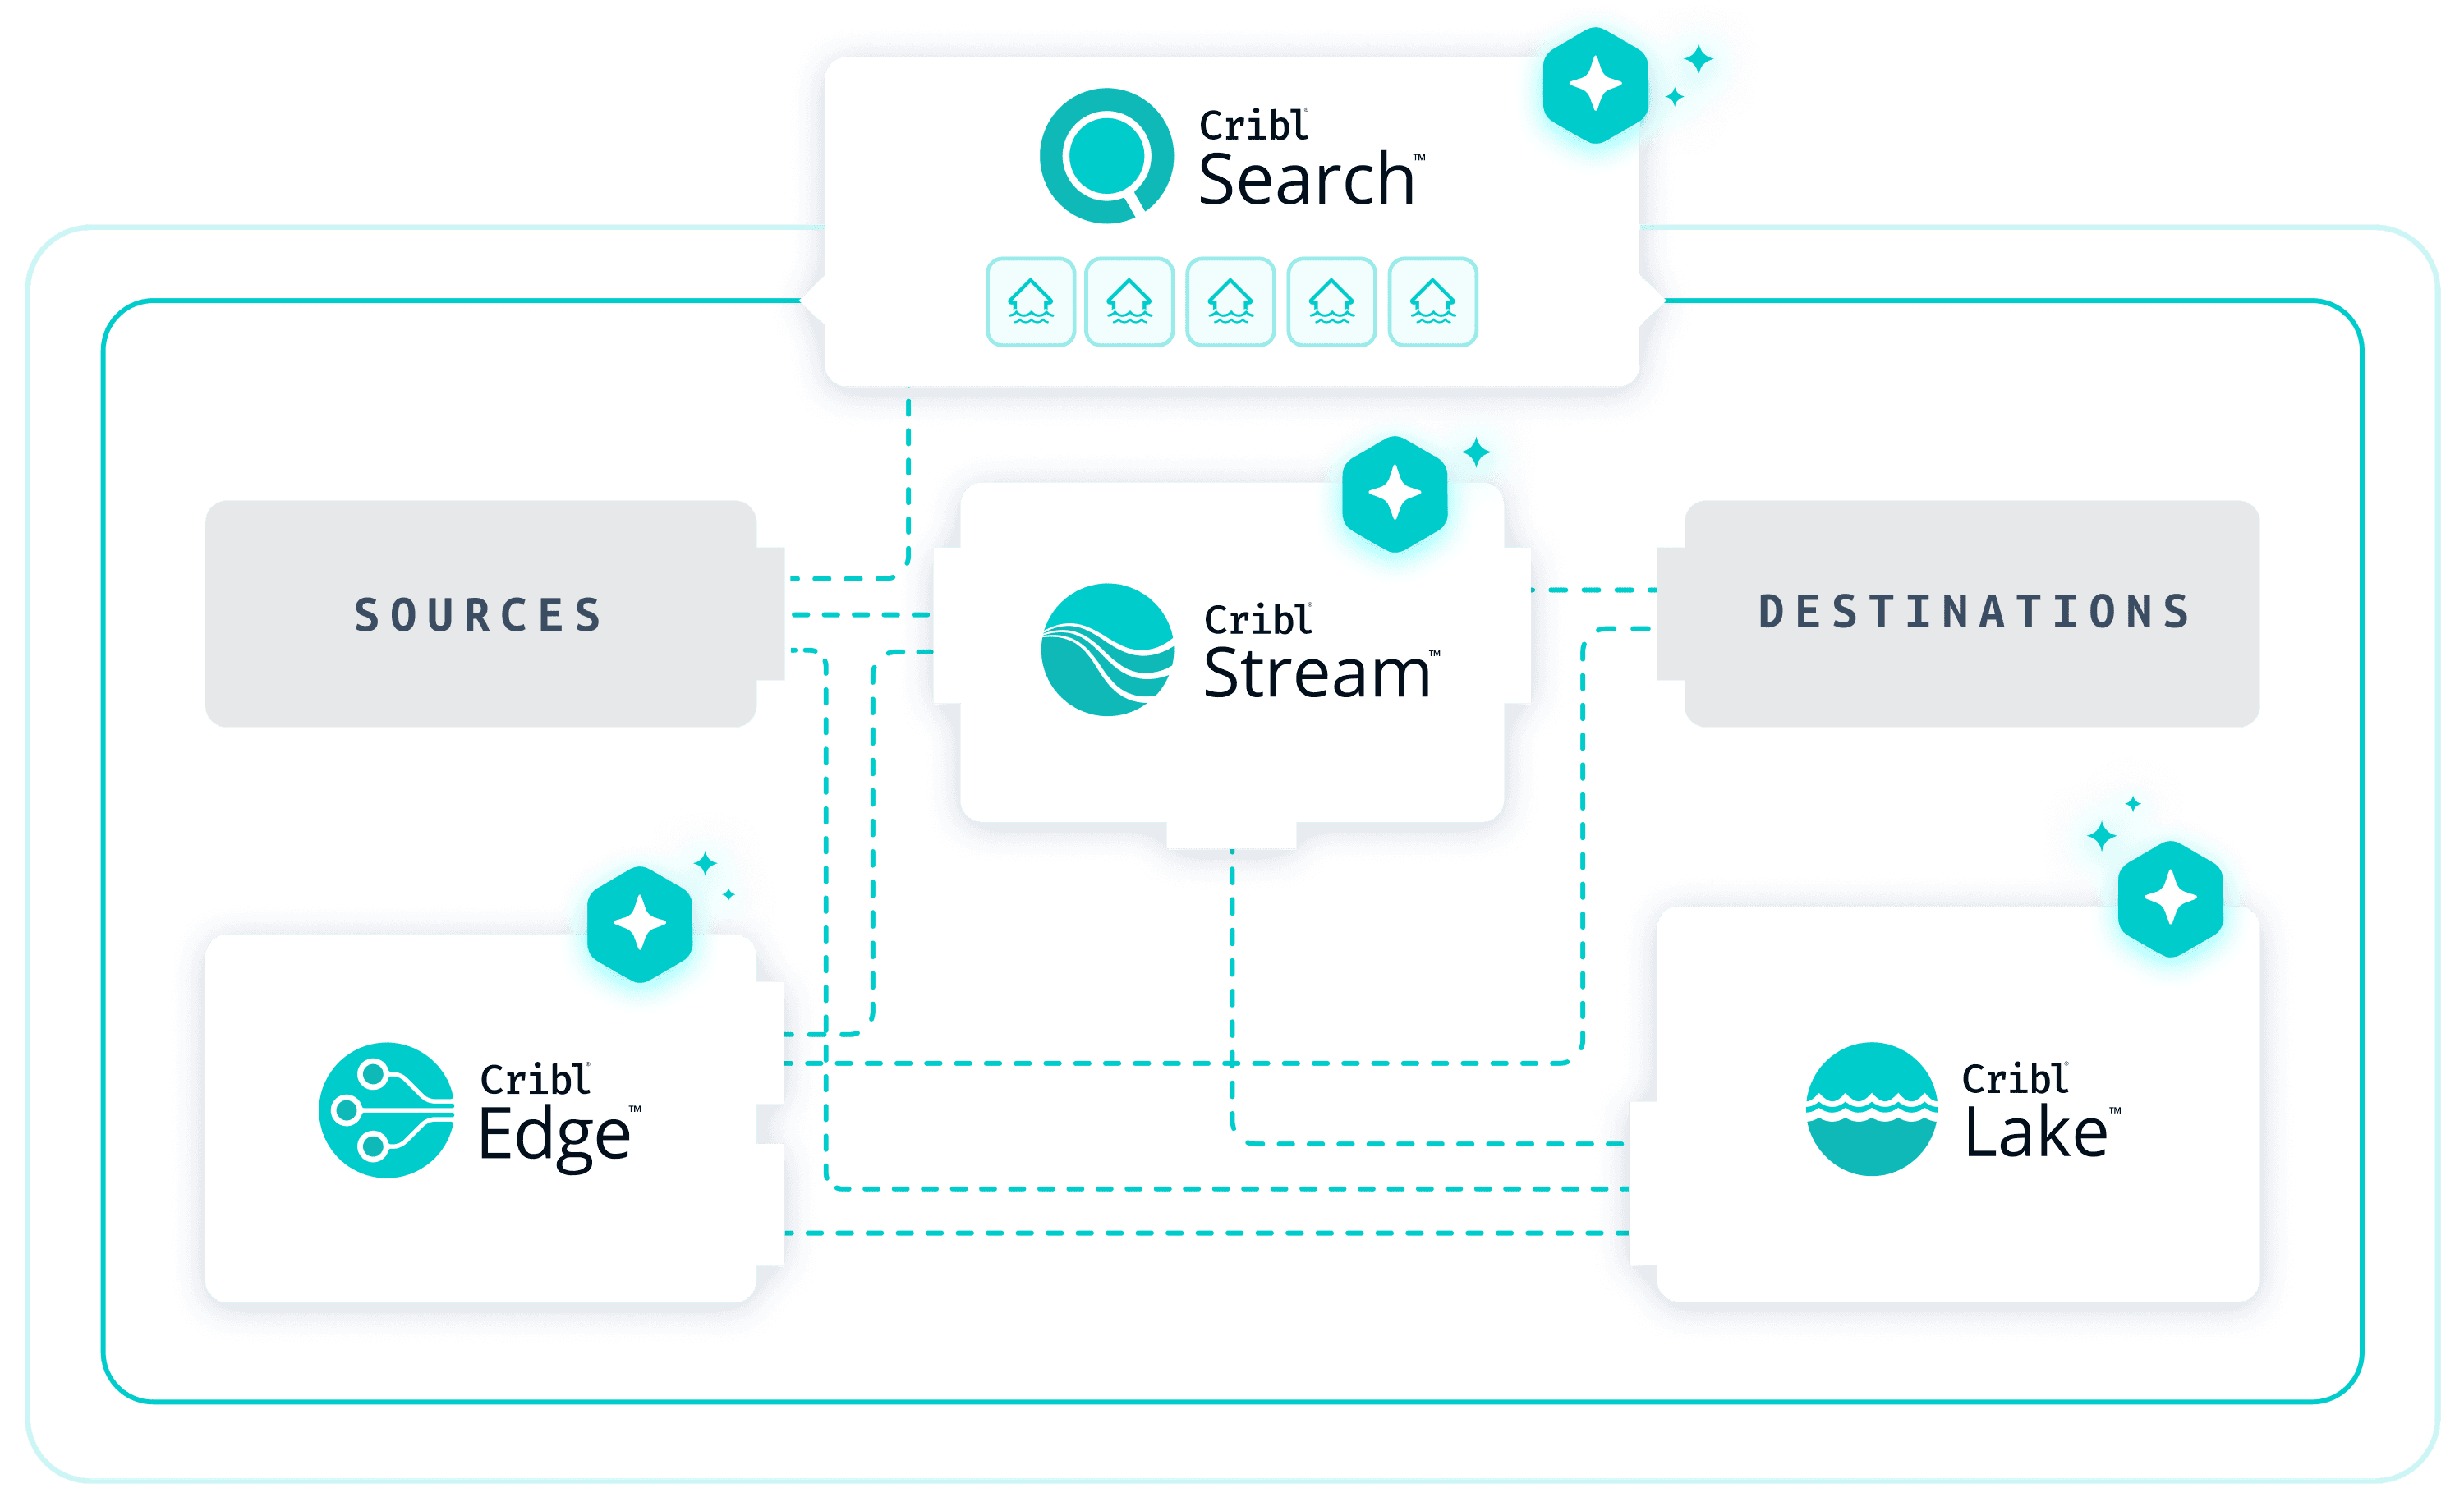
What this means for investigations
Without Cribl, many SRE teams operate around a center-of-gravity observability stack: agents ship data directly into one or two premium tools, hot storage powers dashboards and short-retention search, and cold data goes into object storage as compressed blobs that require custom tooling to query. Over time that stack becomes expensive, brittle, and hard to extend.
With Cribl in place, Stream and Edge form a vendor-neutral intake layer between sources and destinations, giving SREs control over what data goes where and in what shape. Cribl Lake stores large volumes of reliability data in low-cost object storage while keeping it fast to query. Search becomes the primary investigation hub, spanning both Cribl-managed data and external systems via federated search.
Premium observability tools stay. They keep doing what they’re good at — traces, alerting, rich dashboards. Cribl takes on the investigation layer, the long-tail questions, and the agentic workloads that would otherwise break the budget or collapse the stack.
What to measure
SRE leaders need to see movement in real numbers, not vibes.
Teams adopting Cribl as an investigation hub typically track improvements along a few dimensions:
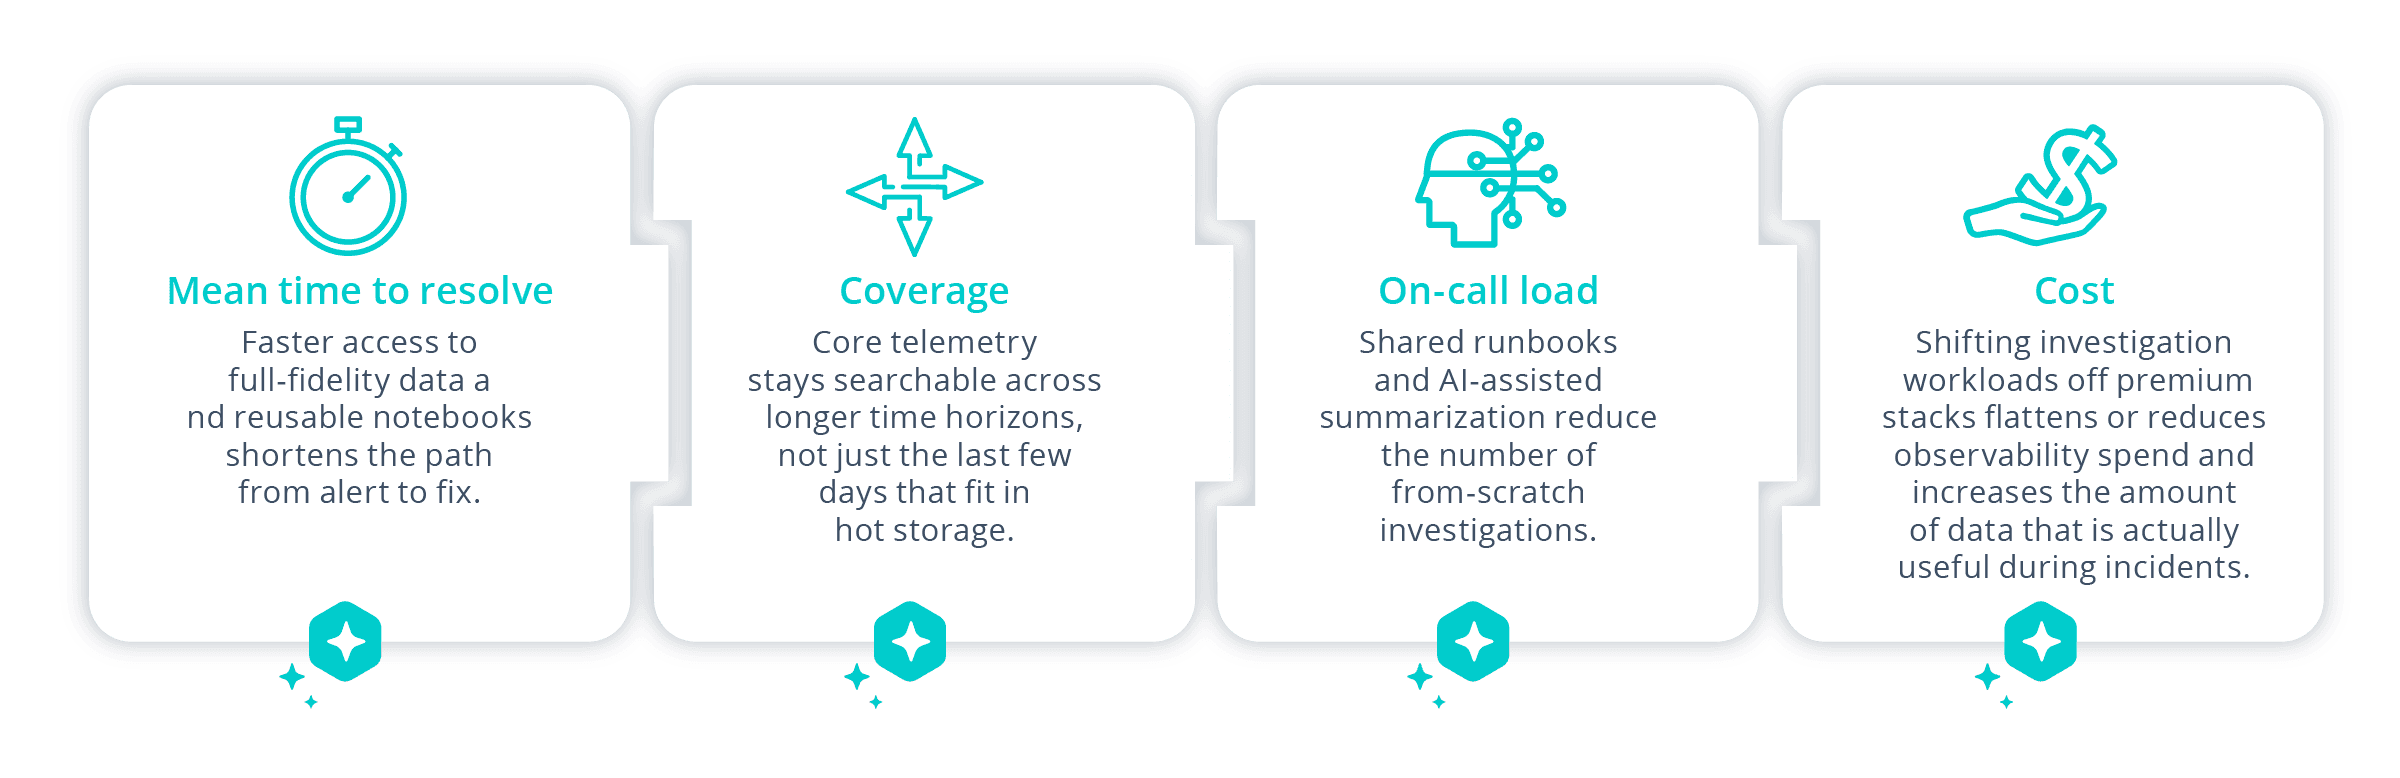
You don’t have to migrate everything to see the impact. One high-value workload — SLO breaches for a core API, recurring crash loops after deploys — is often enough to demonstrate what’s possible.
Getting started
The most effective approach isn’t a big-bang migration. Start with one painful incident type, wire in just the data you need, and run the next incident entirely through Search and notebooks. Capture what works. Turn the investigation into a reusable artifact.Then expand: give service owners governed access to the same datasets, start pointing AI agents at Search for summarization and “what changed?” queries. Then build from there.
The goal isn’t to automate SRE work away. It’s to make every SRE — and every developer on call alongside them — more effective, with better tools and less time wasted as human glue between systems that don’t talk to each other.
The real opportunity
SRE teams sit at the intersection of reliability, velocity, and cost. They’re expected to ship faster, fail less, and figure out how to use AI — all while telemetry keeps growing and budgets stay flat.
Traditional observability stacks weren’t built for that. They were designed for humans clicking through dashboards, not for fleets of AI agents, deep historical investigations, or developers and SREs collaborating across cheap object storage and premium tools in the same workflow.
The next generation of reliability work looks different. Investigations are faster because the right data is always reachable. Runbooks are real because they’re built from actual incidents. AI agents help with the cognitive load without taking over judgment calls. And on-call feels less like an endless stream of one-off boss fights, and more like a practice you’re actually getting better at.
You can’t eliminate incidents. But you can resolve those incidents faster, with more collaboration, and with continuously improve the SRE function.


