

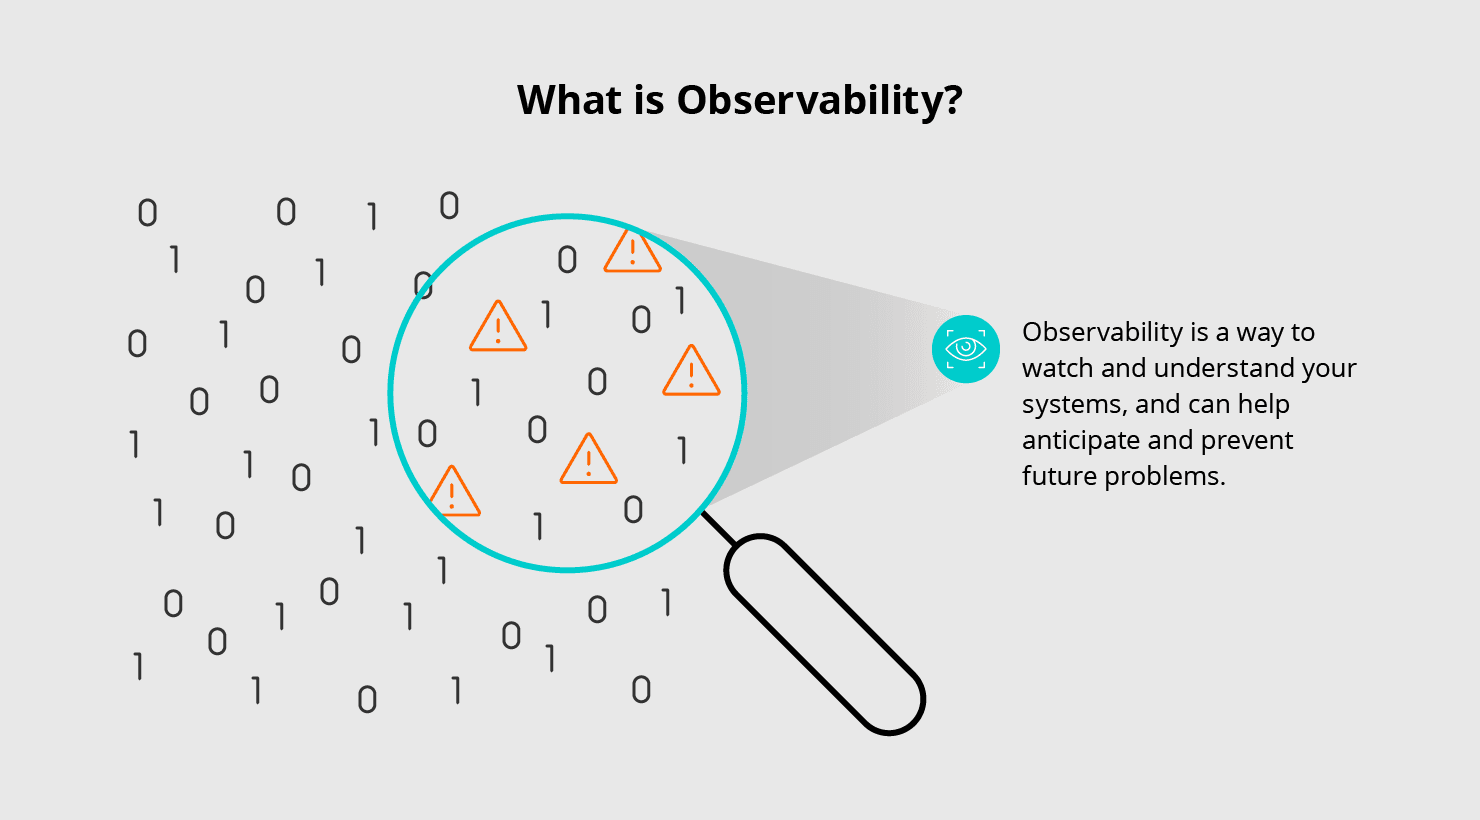
What are some observability examples?
An observable system is any system whose outputs let you reconstruct what happened and why. Consider the badge reader at your office. Every time someone scans in, the system generates data: who entered, when, and through which door. Each event is a log. To collect, reduce, and clean up that data before sending the valuable parts to your analytics tool, you need a pipeline such as Cribl Stream. The badge system is observable because you can ask questions of its outputs after the fact, like whether an unusual entry pattern lines up with a security incident.
The same pattern shows up everywhere. A checkout service emits traces that show where latency spikes. A Kubernetes cluster emits metrics that reveal a pod eating memory. A firewall emits logs that tell you which traffic got blocked. Explore more observability use cases and examples to see how teams put this into practice.
What is the difference between monitoring and observability?
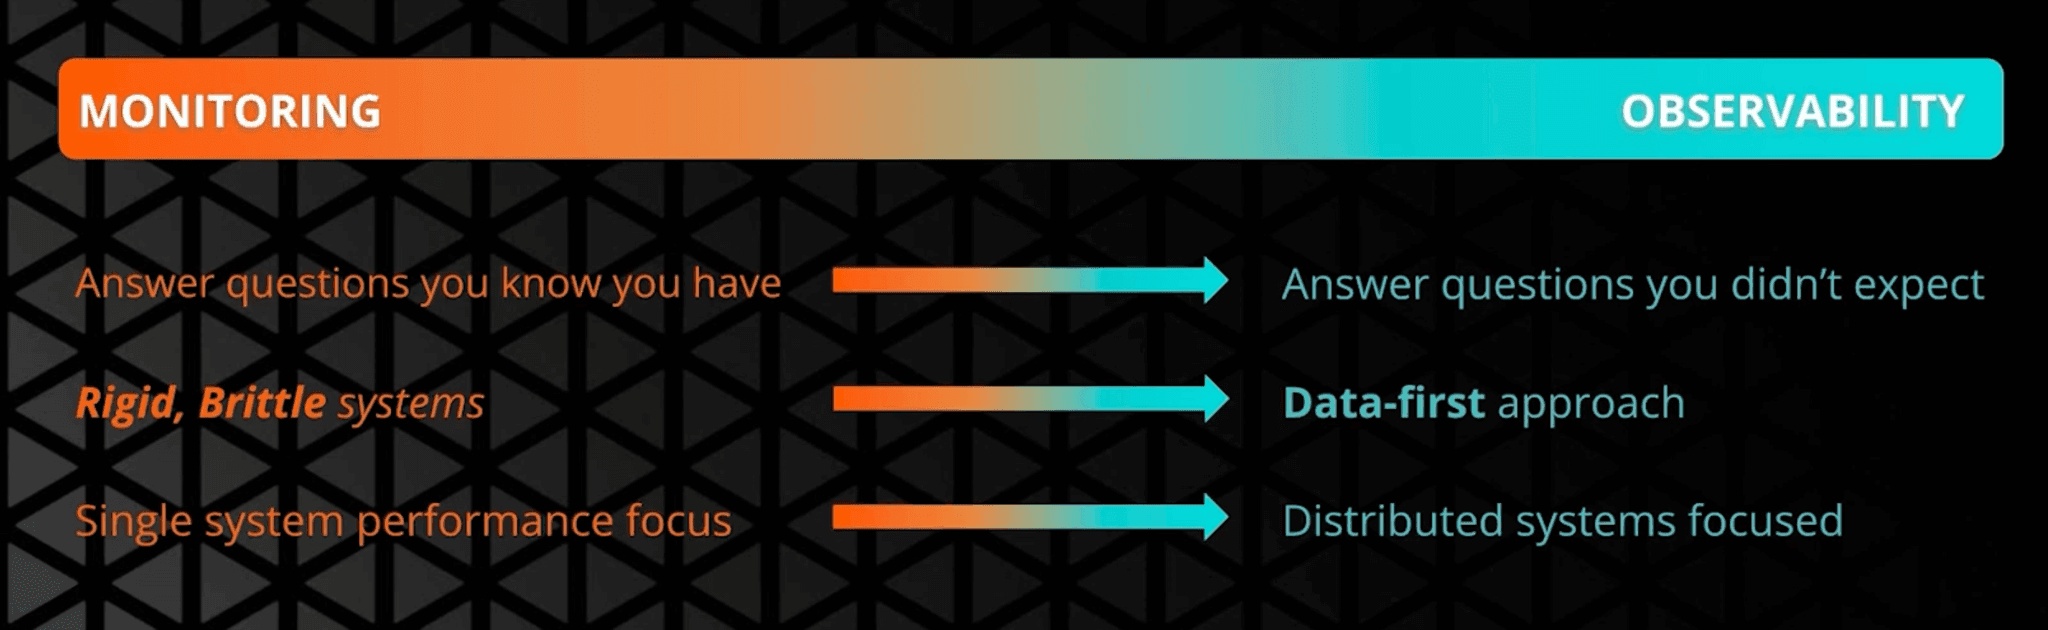
Monitoring tells you that something is broken. Observability tells you why.
Monitoring is built around predefined dashboards and alerts. You decide in advance which conditions matter, and the system tells you when they occur. That is useful, but it only covers failure modes you already know about.
Observability is what you reach for when the unexpected happens. You analyze a system's outputs in context, follow the evidence, and work backward to root cause. You do not need to know the question in advance. In practice, monitoring is one output of a good observability strategy, not a replacement for it. For a deeper comparison, read our breakdown of observability vs monitoring vs telemetry.
Why is observability important?
Observability matters because the hardest outages and degradations are the ones you did not instrument for in advance. As architectures become more distributed, discovery becomes as important as detection. Observability helps your team uncover new signals, connect system behavior to business impact, and cut time to resolution.
The economics make it urgent. Cloud-native organizations routinely generate more than 5 to 10 TB of telemetry per day, and a meaningful share of it is redundant (according to Gartner, Prepare for the Future of Observability, 2024). Median spend on observability platforms now exceeds $800,000 per year for a single vendor, with year-over-year increases topping 20% (according to Cribl, 2026 Trends and Predictions Report, 2025). Collecting everything and hoping for the best is no longer a strategy.
When implemented correctly, observability flips that equation. You capture the data that matters, route it where it provides value, and give both humans and AI agents the context they need to act. Read more in The Strategic Importance of Observability: Discovery to Data Control.
What are the benefits of observability?
Observability gives IT and security teams greater control over system data, so they can manage and analyze logs, metrics, and traces efficiently. A well-implemented observability strategy lets you:
Make data usable and accessible. Critical insights are available when you need them, which speeds up decisions and investigations.
Optimize storage and licensing costs. Filter noise and route only relevant data to each destination so premium tools only see premium data.
Simplify data collection. Reduce the number of ingestion points, aggregate telemetry from any source, and stop managing a separate agent for every tool.
Resolve incidents faster. Correlated signals shorten the path from alert to root cause, which lowers MTTR and protects uptime.
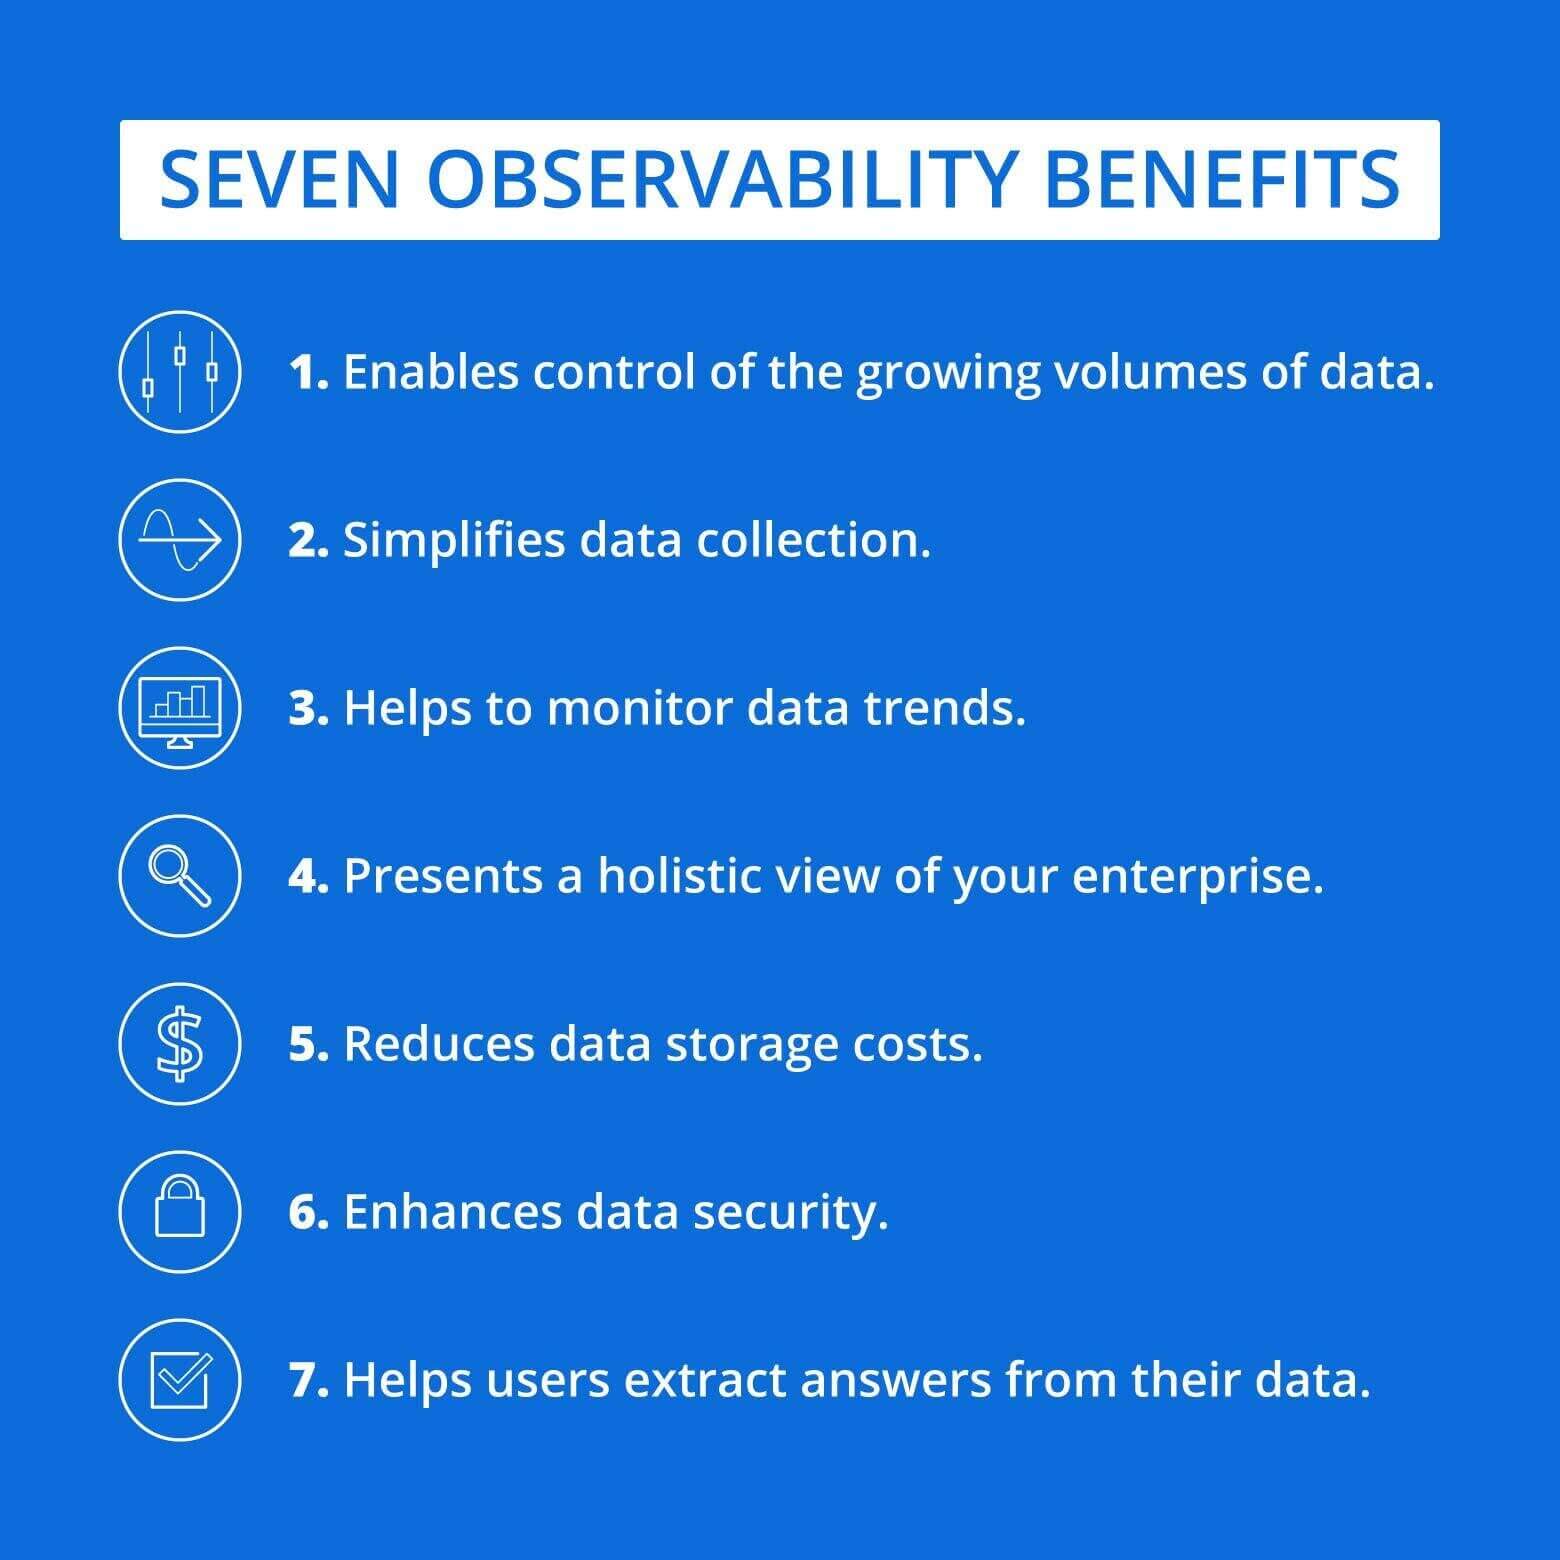
Learn more about the benefits of observability.
What are the biggest observability challenges?
Observability delivers real value, but it comes with real friction. Tired of tool sprawl and data overload? You are not alone. The most common challenges include:
Overwhelming data volume. Modern systems produce vast amounts of telemetry. Without proper data filtering, you end up storing everything and discarding most of it later.
High processing and storage costs. Retaining everything without optimizing for relevance drives up infrastructure, storage, and data transfer bills fast.
Tool sprawl. Multiple tools mean multiple interfaces, data formats, and agents, which adds cost and slows your team down.
Complex modern environments. Microservices, containers, and hybrid cloud make end-to-end visibility harder to achieve without a deliberate strategy.
Alert fatigue. Too many alerts, especially false positives, cause teams to miss the ones that matter.
The fix is not more tools. It is smarter data handling. Strategic filtering, compression, and cost-efficient observability pipelines prioritize actionable insights while cutting unnecessary storage and processing. Consolidating tools, setting clear retention policies, and automating repetitive work help you keep visibility high and costs predictable.
What are the pillars of observability and how does it work?
Observability is usually summarized as three signal types: logs, metrics, and traces. Each answers a different question.
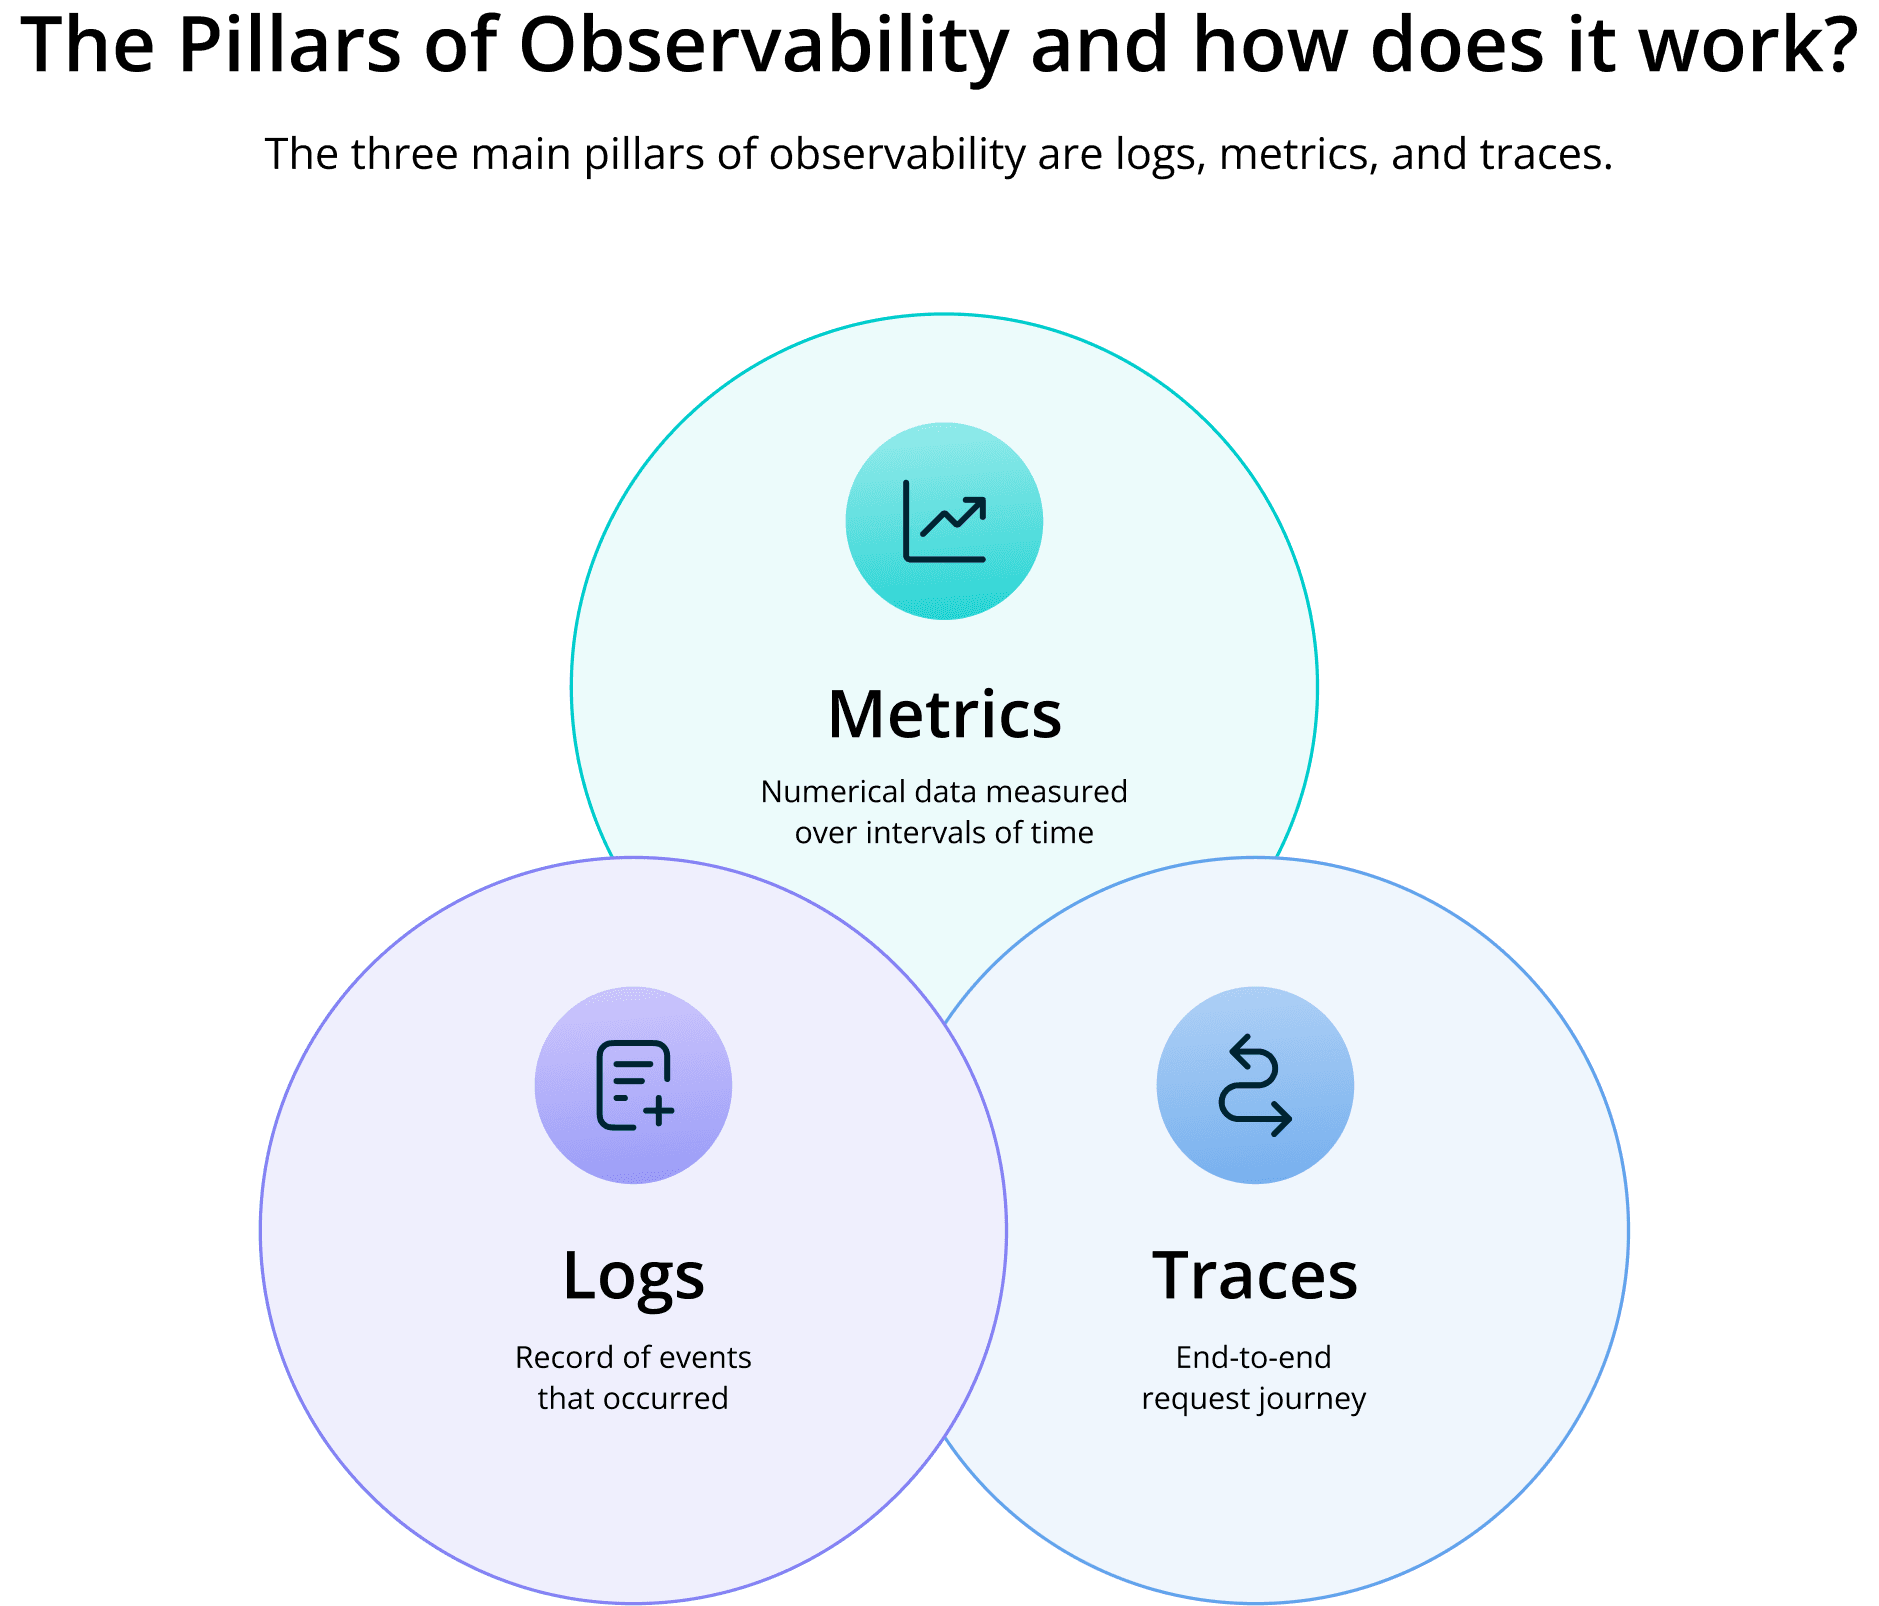
Here is the catch. In real environments, the value does not come from any single signal. It comes from correlating signals around the problem you are solving. A metric spike points you to a window of time, logs explain what happened in that window, and traces show which service caused it. Treating each as a separate pillar creates silos. That is why we suggest thinking in layers instead, an idea we unpack in The Layers, Not Pillars, of Observability. For definitions of each signal type, see our primer on logs, events, metrics, and traces.
How do you implement observability?
Implementing observability starts with understanding what you have, what your teams need, and where the gaps are. Then you close those gaps with a flexible data layer. Here is a practical sequence:
Inventory your current state. Do you run IaaS in the cloud? Are you using SaaS platforms? Do you already have observability or monitoring systems in place? Know your capacity and capabilities before you change anything.
Talk to every stakeholder. ITOps, SecOps, DevOps, SREs, and AIOps teams all consume telemetry differently. Ask each group which data they need, which tools they cannot live without, and what is missing today.
Map your sources. Log shippers, applications, network devices, cloud services, and custom instrumentation all emit data. Identify which events, metrics, and traces you need and from which systems.
Map your destinations. Where does the data go? Log analytics platforms, SIEMs, APM tools, object storage, databases, and data lakes each have different cost and format requirements. Decide what belongs where.
Put a pipeline in the middle. A flexible observability pipeline decouples sources from destinations, so you can add, swap, or tier tools without re-instrumenting anything.
Measure and iterate. Embed observability in how you run operations, track the metrics that matter, and revisit your data strategy as the environment changes.
A word on licensing. If you are on a freemium contract with restricted capabilities, plan for upgrades. If you rely on open source, remember that free software still carries real costs in engineering time, scaling, and support once you are running it in production.
For a step-by-step walkthrough, see how to implement a cloud security observability strategy in six steps.
What is the Future of Observability?
The future of observability is being shaped by the rapid evolution of IT environments, the explosion of telemetry data, and the need for deeper, faster insights across increasingly distributed systems. While pervasive application instrumentation-embedding high-fidelity data collection directly into applications-remains foundational, several key trends are redefining what’s possible and what’s necessary.
OpenTelemetry and Standardization
OpenTelemetry (OTel) is rapidly becoming the industry standard for collecting and transmitting observability data. By unifying how telemetry is captured across different platforms and vendors, OpenTelemetry breaks down data silos and reduces reliance on proprietary agents. This standardization enables organizations to simplify instrumentation, increase flexibility in tool selection, and lower operational costs. As it matures, expect deeper integrations with AI, improved trace context propagation, and broader support from major vendors.
Cost-Efficiency and Data Management
As data volumes soar, controlling observability costs is a top priority. The future will see greater adoption of intelligent data filtering, adaptive retention policies, and dynamic observability pipelines that scale data collection based on system activity. Organizations will focus on capturing only the most valuable data, consolidating tools to eliminate redundancy, and leveraging tiered storage to optimize spend-all without sacrificing insight.
A Strategic Advantage for the Business
Observability is expanding beyond IT operations to become a strategic enabler for development, security, and business teams. Unified platforms, AI-powered automation, and open standards are making it possible to link system health directly to business outcomes, drive innovation, and deliver better user experiences.
As these trends accelerate, organizations that embrace modern observability practices will be best positioned to manage complexity, control costs, and unlock the full potential of their digital ecosystems.
Check out the entire video by Clint Sharp, CEO of Cribl on the topic.
How Cribl can help with observability
Cribl is the AI Platform for telemetry. We partner with IT and security teams at many of the world's largest enterprises, including half of the Fortune 100, to bridge the gap between AI ambition and infrastructure reality. Our vendor-agnostic platform gives you the choice, control, and flexibility to manage, investigate, and analyze telemetry for both humans and agents, with no lock-in, no data loss, and no compromises.
Underneath is Cribl's Data Engine for IT and Security, a suite built for the volume, variety, and variable value of observability data. Cribl Edge collects and pre-processes telemetry at the source. Cribl Stream, an observability pipeline, lets you collect, reduce, enrich, and route data from any source to any destination in real time. Cribl Lake stores telemetry in open formats for low-cost, long-term retention and replay. Cribl Search lets you query data in place, across Lake, object storage, and your existing tools, without moving or rehydrating it first.
Together, these products make your systems observable without forcing a rip-and-replace. You keep the analytics tools your teams use, send each one only the data it needs, and retain everything else affordably in case you need it later. Customers use this approach to tame telemetry volume, shrink what they send to costly platforms, accelerate SIEM migrations, and give AI agents governed access to clean, contextual data. So when someone on your team asks what observability looks like in practice, the answer is a data engine that puts you in control.
Ready to see it in your own environment? Start a free Cribl.Cloud trial and process up to 1TB a day with no license required, or get hands-on in a Cribl sandbox.
Observability FAQs
What is observability?
Observability is the practice of understanding a system’s internal state by analyzing its external outputs, such as logs, metrics, and traces. It helps teams diagnose issues, optimize performance, and maintain system reliability.
Why is observability important?
Observability allows organizations to detect and resolve issues faster, improve system stability, and optimize performance. It provides full visibility into complex IT environments, helping teams proactively manage and troubleshoot systems, address unknown problems, and enhance user experiences.
What are the three pillars of observability?
Metrics – Numeric data points that track system performance (e.g., CPU usage, response time), offering a quantitative view of health and trends.
Logs – Event records that provide detailed insights into system activity and help trace the sequence of events leading to issues.
Traces – End-to-end tracking of requests moving through different services, revealing dependencies and pinpointing bottlenecks.
What’s the difference between monitoring and observability?
Monitoring tracks predefined metrics to alert teams when known issues occur—it's reactive and focused on “what” and “when.” Observability analyzes logs, metrics, and traces to understand “why” issues happen. It enables deeper insight into complex systems and helps diagnose both expected and unexpected problems proactively.
How do you implement observability?
To implement observability, organizations should:
Instrument applications and infrastructure to collect logs, metrics, and traces.
Use centralized observability platforms to analyze and correlate telemetry data.
Optimize data collection by filtering and routing relevant information to the right destinations.
Leverage automation, including AI and machine learning, to detect anomalies and accelerate root cause analysis.